Sunday, April 29, 2012

To Sell or Not To Sell In May?

I have been absolutely torn apart by the latest weak econodata vs strong earnings. I am sure I am not the only one.

So we had another weak econodata point on Fri: 1Q2012 Adv GDP came in below the expectations. While many quickly discounted the headline number on the basis of lower govt vs higher consumer spending (thus assuming 70% of the economy is doing OK), I would like to remind them that consumers are only as strong as the employment can allow, and the latter has been disappointing on consistent basis lately. As the matter of fact, weekly unemployment claims are starting to resemble 2011.
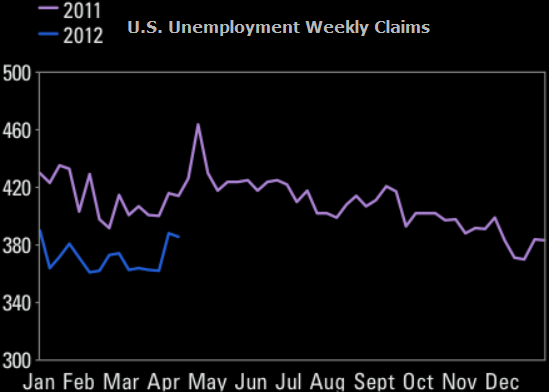

click on chart to enlarge

Next week we will get April NFP and chain store sales. If the employment report is weak, and if we see a m/m slowdown in retail, due to post-Easter malaise, then Q2 consumer spending may take a hit and selling in May could get much more enticing.


click on chart to enlarge

Another strong contributor to 1Q2012 GDP was new construction. While housing has been consistently subtracting, it added quite a bit last quarter. Warm weather was the culprit. But the last reports on new construction may cool down the enthusiasm (pun totally intended). New housing starts hit 5-month low, and new home sales hit 4-month low in March.


click on chart to enlarge

If retail sales and new construction take a dive, there will be no reason to think that 2Q2012 GDP will look any better. Stock market will feel the pain...

But wait! Isn't there Fed to save us from possible sell-off? Bernanke is probably filling his helicopter with "transitory" expensive fuel as I type, getting ready to fly cheap money to all those who are waiting with their hands up in the air. Catch as many as you can, QE3 is back on the table after Q1 GDP miss. Expectation of QE is evident in the dollar index vs gold chart since the FOMC statement on Wed.


click on chart to enlarge

And how about the upwardly revised 2012 GDP projections, brought to us by friendly confused Fed staff, which kept Chairman's itchy QE3 finger at bay? Not even unseasonably warm weather helped U.S. Q1 growth to hit expectations. This makes one wonder what Q2 will look like, since all we hear is how retail sales and new construction were pulled forward.

And then there are earnings... Let's just say that had it not been for drastically lowered expectations for 1Q2012, we would be pushing 1300 and not 1400 on SPX right now. Q2 and full year guidance is another question. It has not been very buoyant, to say the least. Are companies setting us up for yet another underpromise/overdeliver quarter?

Based on the above we have dueling trading scenarios going forward. I have absolutely no idea which side wins the fight, but intend to be on the winning side after the move begins. I am OK with missing the first 2-3% from here. Color me neutral in the SPX 1400 - 1410 zone. Next week may just be the battleground for the ultimate "sell in May and go away" decision to be made.

Thursday, April 26, 2012

Housing Conundrum

After Existing Home Sales' (EHS) sequential m/m decline in March, many traders started thinking that this year will look just like 2011. But today's Pending Home Sales Index (PHSI) data may give the housing the benefit of the doubt. 4.1% m/m increase elevated PHSI passed the century mark for the first time in two years. (100 is a measure of PHSI "healthy contract activity", I guess it is somewhat similar measure to 50 for PMI, which is +/- line)

So we have a divergence in March closed vs pending contracts (as if we needed another one). Adding to the conundrum are conflicting comments from National Association of Realtors (NAR) itself - the aggregator of data. From today's PHSI report they seem to have a clue that “The housing market has clearly turned the corner. Rising sales are bringing down inventory and creating much more balanced conditions around the county, which means home prices will be rising in more areas as the year progresses”. Ironically, NAR blamed lower March EHS on none other than declining inventory. Here is what NAR said in its EHS report: “We were expecting a seasonal increase in home listings, but a lack of inventory has suddenly become an issue in several markets with not enough homes for sale in relation to buyer interest. Home sales could be held back because of supply factors and not by demand – we’re already seeing this in the Western states and in South Florida.

Also, we have to take into consideration the fact that contract cancellation rate has skyrocketed lately, standing at whopping 33% in January of 2012. NAR has decided to stop collecting that data in March: "We are no longer publishing data on contract cancellations because many buyers are staying in the market and offering another contract, and sales have been holding up much better than the fallout rate would imply". I am dismayed! So now this is no longer relevant? Let's just omit every data point that looks out of whack from now on!

I suggest we wait for EHS report on May 22 to draw our own conclusions. If we see another m/m decline, housing market will look doomed for sure.

click on chart to enlarge

Wednesday, April 25, 2012

Tales of Two Economies, Stocks, and Markets

Stock market fundamentals got even more confusing today.

Economy
Fed puzzled the traders by pulling Twist extension, but Bernanke's entire press conference emphasis was on "exceptionally low levels for the federal funds rate at least through late 2014". I can sum up his comments for you in my own words - we can't see through walls which we can't see in front of us.
10-yr t-note yield ended the day below 2%. Enough said...

Stocks
Very interesting divergence is depicted in AAPL vs CAT. I think that details of two companies' quarterly reports confirm that Chinese economy is now moving from industrial to consumer based. Market recognizes the consequences of shifts like that. Thus, commodities, industrials, basic materials, energies, and transports will probably have to cool off for a bit more, as the technologies may shine.


Markets
Hence, my view on markets is the following: there may be a continued SPX underperformance vs NDX. And that makes me very worried...

Sunday, April 22, 2012

SPX - Two Scenarios

The trading thought for next week is very straightforward - trade S&P 500 according to two possible scenarios. Enjoy the rest of your weekend!

click on chart to enlarge

Friday, April 20, 2012

Can Market Decouple from Apple?

The simple answer is NO. I am going to quickly show you why.

AAPL:

Highest valued company in the world (by market cap)
20% of NASDAQ 100
5% of S&P 500
Accounted for 1/3 of Tech Sector's 20% gain this year
Sole reason for Tech Sector's earnings growth of 7.5% in 1Q2012 (0% without it) and 6.7% revenue growth (2.3% without it)

Some may ignore these facts at their own peril. AAPL has become "the proxy for the whole market" (pardon my sarcasm).

The chart may be telling us something... Head and shoulders has formed. If 570 neckline gives, price may fall to 548 and 526 supports.


click on charts to enlarge

Thursday, April 19, 2012

Tricky Trading Ahead

Trading is always a puzzle. If it was easy, everyone would make money. Take real estate for example. Everyone and their brother got into it all at once. Result - possibly a decade of losses and agony. Sorry, I digressed, back to trading... We have an amazing and quick opportunity to take S&P futures down to 1320 - 30 or so, or it may rip higher to 1430 - 40. WOW, 50 - 60 handles either way!

Culprits:

Bad
1. Spanish auction went well but EZ peripheral bond yields are higher still and IBEX and FTSE MIB are cratering again,
2. MSFT earnings and/or guidance may disappoint,
3. we may have a usual weekend risk-off with Israel/Iran and N.Korea back in the news,
4. and econodata in U.S. was weak again today.

On the last point. Trend in economics is important. I will not say that we are establishing one on the downside just yet, but weekly claims above expectations for two weeks in a row, another regional mfg survey is lower (Philly Fed today after Empire earlier in the week), and existing-home sales are not buoyant after all - sequential m/m 2.6% decline in units sold. This is disappointing economic news.

Good
1. On the other hand, earnings are surprisingly good,
2. and fund managers are out there salivating right at or slightly above SPX cash 1370.
3. Also we have FOMC meeting coming up
4. and AAPL earnings next week. (OMG! Apple, again...)

To complicate things further, Fri is OpEx.

Here is my chart. A little busy, but you get the idea... Gaps above and below, channels to hold and break...

click on chart to enlarge

Tuesday, April 17, 2012

Quick Market Note

Without a doubt, this market is now starting to remind me 2011, when it traded mostly on EZ debt crisis news. Today's Spanish bill auction went well, so U.S. futures reacted overnight to better news from Europe. If this is any indication of future trading environment, then Thursday's Spanish bond auction (which is more important than today's bill sale) will produce even bigger move. I am not sure that today's auction is a good prediction for Thu, because it was a short-term paper, and Thu will be long-term (2yr and 10yr).
So, fasten your seat belts...

Monday, April 16, 2012

GAP Flash Crash?

GAP is crashing. No, not the retail store. The other GAP - Google, Apple, Priceline.
There is no question that today's price action in GAP makes one think what stock market is paying closer attention to lately. Retail sales came out a bit better this morning. Futures immediately reacted positively, as they shook off the overnight slump. But it all got nullified as soon as cash market opened. Why? Google, Apple, and Priceline decided to take a collective dive. These high-flyers are now controlling ever-increasing share of NDX (they account for almost 30% of the index). If you take these leaders down 2-3%, it hurts the overall index. So, no matter what the economic news of the day is, keep your eyes on GAP.
I heard many traders debate which of the three will reach $1000 per share first. Could they be racing the other way? Let's see which one gets to $500 first. I pick GOOG.

click  on chart to enlarge

Sunday, April 15, 2012

Visual Trading Thoughts for Week of April 16, 2012

A picture is worth a thousand words. Following charts are self-explanatory: head and shoulders, broken trendlines and bull flags, widening sovereign bond yield spreads in EZ, individual investors fleeing U.S. equities, and myriad of divergences - all may finally be coming to resolution.

CRB/SPX

JJC/SPY

FXA/SPY

FXC/SPY

FXI/SPY

EEM/SPX

Italy/Germany 10/10 Yield Spread

Spain/Germany 10/10 Yield Spread

IWM/SPY

XLB/SPY

XLE/SPY

Put/Call Ratio


Mutual Fund Flows (reported by ICI)


Wednesday, April 11, 2012

DAX and SPX Recoupled

Many investors had a nagging feeling that Eurozone debt crisis is not over, but merely postponed by LTRO. They were correct. The developments in Spain and Italy are now getting full attention of the market. But it is important to point out that this latest phase started in March and was evident in roll-over of European equities, while being completely ignored by SPX. Sovereign bond yield spreads of aforementioned EZ peripherals vs core are quickly becoming the leading charts. Due to this, ECB and/or EFSF are expected to calm investors down for a bit as soon as they step back into the bond market to put out the fire. I think equity shorts may decide to cover prior to or on the intervention.

My best signal will be DAX futures holding 6450 horizontal support. Why DAX? While SPX divergence vs many other risk assets has been wider and longer, it has been very closely correlated to DAX from the bottom in October, and decoupled from it for only brief period of time in March, when SPX made a higher high and a higher low but DAX did not. You can see from the chart below that they now recoupled. DAX futures 6700 support was broken (coinciding with SPX 1370 break) and price is currently backtesting from below. If resistance holds and DAX proceeds down to lower support, SPX will follow. With this and possible ECB/EFSF bond intervention in mind, it would be appropriate to assume that if DAX futures hold 6450, SPX futures may find support then as well. Keep your eyes on this chart.

DAX futures vs SPX futures
click on chart to enlarge
 

Tuesday, April 10, 2012

Was Facebook/Instagram Deal The Top?

I am not a computer geek, and probably just average in understanding what all the latest hot technology has to offer. So I have to say that yesterday's Instagram acquisition by Facebook puzzles me. I will not go into the fundamentals of the deal. Hold on, there are none to be discussed!!! 30 million people share photos on their mobile devices, with absolutely no current revenue or any plan thereof, it is free! I can not find any other reason for this acquisition beside taking out a competitor prior to Facebook's IPO. I guess Instagram was growing a bit faster than Facebook was comfortable with (my daughter did tell me "how cool Instagram is, and how she spends less time on FB now"). So in result, Facebook paid $1 billion for photo-sharing free iPhone app. (OMG, Apple, again...) If this was not the top of tech rally, then there must be one coming when Facebook goes public in May. Add another reason to "sell in May and go away". Or did Facebook/Instagram deal give us an early sell signal yesterday??

Thursday, April 5, 2012

Trading Thoughts for Week of April 9, 2012

When S&P 500 began its ascent from 1075 in early October of 2011, there were very few bulls and a lot of bears on the Street. Nobody could predict back then that we would be up 32% from the bottom and above 1400 by April. So many respectable market watchers are becoming extreme bulls today. Now that 1400 is taken out, it looks like a starting point of a new bull market to them. I hear "it is 1990s all over again", and "p/e multiple expansion is coming", and "Apple is going to be the first $1 trillion market cap company - it is an asset class of its own", and "U.S. has decoupled from the rest of the world". Their bullish arguments portray the usual sentiment at the top of enormous rally. They want to be bullish now just like they wanted to be bearish in the beginning of October.

Traders, we have to relax and put our cool heads to the following facts: we have not touched 50 dsma on SPX for 105 calendar days in a row, market internals absolutely stink, and divergences are aplenty and are getting wider. God knows I have shown enough of them here in the last month to make one sick. Yet the market is plugging its ears with Fed's easy money (which may finally be ending) along with better-than-expected U.S. econodata, and just rolls on to defy any laws of gravity. Nobody gives a damn about technical and fundamental divergences, when AAPL just keeps on making new highs, while it marches to analysts' price targets of $700 - $1000 per share (which seem to be increased on daily basis), as they tell us that "AAPL is a proxy for the whole stock market". Where have I heard that before? In total dismay and awe, I have to continue saying: this is not going to last much longer. 

I do not want to turn this post into a rant, I will stay constructive and would like to expand on the decoupling theory. People who now say that "U.S. has decoupled from the rest of the world", are the same folks who told us before that "world economic growth will pull U.S. out of recession". You just can't have it both ways! I have said here before, I do not believe that U.S. stock market can continue climbing higher with the rest of the world not confirming the move. I would like to show you how other major world stock markets are diverging from S&P 500. Beside Mexico, none else took out their last year's high. Moreover, many of them topped out and rolled over, possibly flagging the end of the risk rally which began in October. These markets are on the same planet as U.S. Yes, S&P 500 has momentarily decoupled from them, but I think that it will eventually succumb to the inevitable pullback, which is long overdue.

Before I spill aforementioned charts to think about over the weekend, I would like to enlighten you on an interesting fact. As U.S. supposedly decouples and grows faster than the other economies, U.S. dollar appreciates against the currencies of those nations, thus causing a headwind for U.S. multinational corporations' earnings from abroad. Following is a good example. Try to decouple this news, which came from Gartner (information technology research company) earlier today:

Gartner's forecast for dollar-valued global IT spending growth in current U.S. dollars has been revised down from 3.7% to 2.5% for 2012. In constant U.S. dollars, i.e., stripping out the effect of exchange rate fluctuations, our forecast for global IT spending growth in 2012 has been revised upward from 4.6% last quarter to 5.2%.


As I leave you with charts of SPX and the other major world markets, I would like to wish everyone very happy Easter and Passover!

(in order below) US, Mexico, Canada, Brazil, UK, Spain, Italy, France, Germany, Russia, India, Korea, China, Hong Kong, Japan, Australia

click on charts to enlarge


Wednesday, April 4, 2012

Is it time to short EUR/USD again?

I would like to make a case for EUR/USD short.
Here are my thoughts:

Calm before the storm?
LTRO put Eurozone debt crisis on the back burner. But in the last few weeks debt woes of Spain and Italy are back in the news. Their bond yields are going up again. These countries have behemoth outstanding debt, which makes them practically impossible to bail out, even if EFSF, ESM, and other alphabet soups run together. Bond investors are getting worried that Spain's budget deficit above previous target is setting a bad precedent for "new fiscal treaty". Contagion could spread to Italy, which itself has quite a few issues with labor unions. Portugal, not to be outdone, is being mentioned as the next possible restructuring candidate.

Weak Econodata
The economic picture in Eurozone has been getting worse, and not just in periphery. From unemployment, to PMIs, to retail sales - all data has been coming in very weak. It will be hard for economy to rebound due to austerity and tight credit.

FOMC
Today's release of last FOMC meeting minutes is probably the single best reason for this trade. Market was not prepared to hear hawkish details. Well, let's rephrase that - less dovish... Obviously, Bernanke & Co. could throw us for a loop again, but the market will pay less attention to them and really focus on econodata. It has been coming in stronger in U.S.

COT
Market has gotten less bearish on EUR/USD lately. COT chart below shows a gradual reduction in large spec shorts.


Technicals
Price ran into resistance at the top of the channel and is currently inside the wedge. Somewhat of a head and shoulders has also formed. 1.3135 - 45 area is a very critical support. There is a horizontal and trendline running through that zone. If it fails, short-term bullish structure becomes suspect. Traders will target 1.2975 - 1.3025 area, and if that does not hold - price would be heading to January low.
Resistance comes in @ 1.3250 - 1.3280 area, followed by 1.33 and WP a few pips above.

click on chart to enlarge

I am not sure how this trade may play out, due to pretty newsy rest of the week. We have ADP, ECB, and NFP on Wed and Fri, with the latter being illiquid holiday trading session. I would like to short a bounce to the resistance, or a breakdown below the support.

Tuesday, April 3, 2012

Did China Mfg PMI Just Top Out?

We all have discussed China Mfg PMI in the last few days, ad nauseam. While traders decided to discount HSBC and focus on Official data at this time, I decided to chart both in the last five years.

I would like to draw your attention to how Official Mfg PMI topped out, making the high for the year, between March and April in four out of the last five years.

I am sure that everyone will rush to tell me that this time will be different.

click on chart to enlarge

Sunday, April 1, 2012

What is the real China PMI?

Investors were glued to their computer screens (yours truly included) on Saturday night @ 9 pm edt. China official (Politburo) Mfg PMI was being released then. It came in @ 53.1 - way above expectations. Traders took to Twitter in celebratory lap: "This market is going to rock on Monday". Only 90 minutes later, HSBC Final Mfg PMI @ 48.3 showed a much different picture. Nobody even noticed or cared, as it is weekend for God's sake, and attention span of investors is quite short nowadays anyway. I also understand that in bull market bad news gets ignored.

We have witnessed many unresolved divergences during the last few months affect virtually nothing in this bull market, yet this one deserves a deeper analysis, as the slowdown in China has been in the center of traders' attention lately. The Politburo data comes from large gov't enterprises, while HSBC gets theirs from small to mid-sized private companies. Also we have absolutely no idea how accurate the official data is, while HSBC explicitly details data collection and index calculation process in their report.

So who do we believe? At first I thought it is appropriate to ask the question. But as I think more about how different the sources of the data are, I realize that there are two economies inside of China. Large government-controlled manufacturers are getting a preferential treatment, while smaller mfg's may be falling off the radar in tougher times. While I think that there are no 100% private companies in China, small to mid-sized companies are probably more affected by gov't regulation and/or lack of easy credit, as commercial lending has tightened. RRR cut was widely expected, but now is in question due to better Politburo PMI. And even if it comes, large gov't enterprises will always have their funding, but it is less certain for smaller firms. We are also left wondering if smaller manufacturers are being blocked from deals and gov't monopoly is continuing to run wild, just as everyone is led to believe that capitalism is being widely embraced by corrupt Chinese officials. There is just not enough evidence and not enough reporters are talking (or allowed to talk) about this. Fear of their access being cut off by Chinese authorities is enormous.

So, the more correct question is - how will the market react on Monday? First of all, China is closed for three sessions, due to holiday. The rest of the world financial markets will have to decide on their own which PMI to believe.
I put the last 12 months of data on the chart below. I think that it is only going to get harder to forecast the real China Mfg PMI from here on. My biggest hope is for HSBC to analyze the data from Politburo and come up with a blended index. But then you have to assume that gov't data is real. I do not know how to verify that.