 |
click on chart to enlarge |

Thursday, March 29, 2012
A look under the hood of SPX
On March 27th S&P 500 made a new 3-yr bull market high. While one can not argue with price of the entire index, a closer look reveals that only 4 out of 10 SPX sectors (53.7% of index) surpassed their 2011 high. Furthermore, only 5 sectors (68.7% of index) were able to make their new 2012 high.
Wednesday, March 28, 2012
Monti Backpedals
Italian Prime Minister gave us mixed messages over the last few days. On Saturday he was worried about contagion from rising Spanish bond yields. Today he backpedaled and tried to calm the investors:
Perhaps the following data (released today) will make things clear again. Eurozone is in recession. LTRO helped to alleviate banking crisis but is yet to boost private lending. Deposits growth increased (trillion of ECB euros is sloshing in a tub), but loans to private sector grew the least since June of 2010. I see two reasons: banks are hoarding cash (hence rising deposits at ECB), and loan demand cratered due to recession.
So, note to Mr. Monti: crisis has entered a new phase.
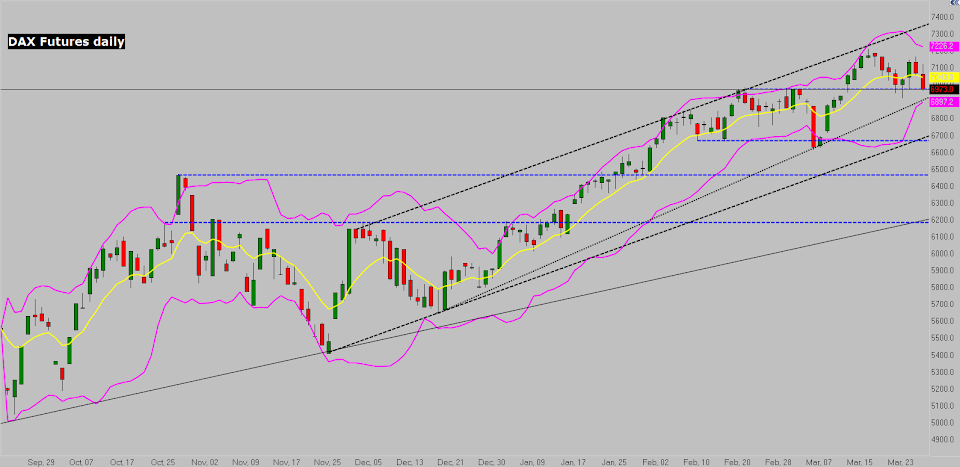
I will let the politicians do their double-talk, and will just track DAX futures chart, since it has been the leader throughout the entire EZ debt crisis ordeal. It is now backtesting the support. Should that give, look for lower trendline of the rising wedge/lower daily BB @ 6900-6920 to be tested next, followed by lower trendline of rising channel/gap fill/horizontal support @ 6670-6700, followed by a major horizontal support at 6470.
"I don't see the flames of a crisis like we saw in the last two years coming again. The fiscal contract now in place should calm concerns about future fiscal imbalances in European countries. The higher the firewall, the lower the probability that the money would ever be needed."So which is it, sir? We are confused...
Perhaps the following data (released today) will make things clear again. Eurozone is in recession. LTRO helped to alleviate banking crisis but is yet to boost private lending. Deposits growth increased (trillion of ECB euros is sloshing in a tub), but loans to private sector grew the least since June of 2010. I see two reasons: banks are hoarding cash (hence rising deposits at ECB), and loan demand cratered due to recession.
So, note to Mr. Monti: crisis has entered a new phase.
I will let the politicians do their double-talk, and will just track DAX futures chart, since it has been the leader throughout the entire EZ debt crisis ordeal. It is now backtesting the support. Should that give, look for lower trendline of the rising wedge/lower daily BB @ 6900-6920 to be tested next, followed by lower trendline of rising channel/gap fill/horizontal support @ 6670-6700, followed by a major horizontal support at 6470.
 |
| Euro Area |
 |
| click on chart to enlarge |
Tuesday, March 27, 2012
Richmond Fed - Problem Ahead?
This morning's econodata is near and dear to yours truly. Richmond Fed showed slower current Mfg growth in Mid-Atlantic region. Numbers are weaker across the board. The most important aspect (for me) is employment - number of employees and avg workweek are down sharply in March.
 |
| Richmond Fed Mfg Index |
Monday, March 26, 2012
And He Flies His Chopper Again
"Helicopter Ben" announced today that operation "money drop" may need to continue. Should we be surprised?
Just 11 days ago I shared two charts, which are the best indicators of his flying endeavor. These dashboard instruments already showed last week that Ben may be gaining the altitude again. Both came to their respective supports and bounced, even before Bernanke's takeoff today.
Just 11 days ago I shared two charts, which are the best indicators of his flying endeavor. These dashboard instruments already showed last week that Ben may be gaining the altitude again. Both came to their respective supports and bounced, even before Bernanke's takeoff today.
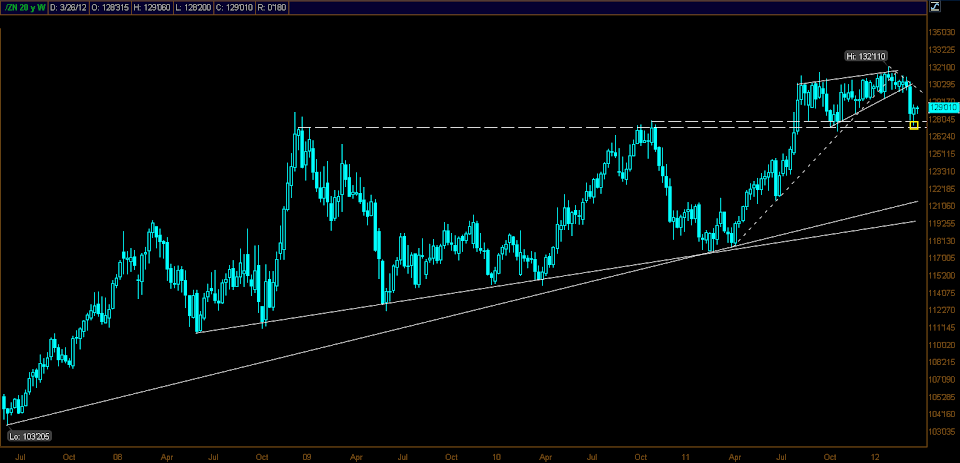 |
| 10-Yr T-Note Futures click on chart to enlarge |
 |
| Gold Futures click on chart to enlarge |
Saturday, March 24, 2012
Weekend Trading Thoughts on Mar 24
It has been a while since I discussed European affairs here. After all, LTRO gave PIIGS much needed reprieve. But Mr. Monti (Italian Technocrat-in-charge) put the focus back on Eurozone peripheral debt sinners over the weekend. I wonder why? His comments about Spain are flying all over the wires:

We share your concern, sir. Yields have risen indeed. Granted, they are well below the pre-LTRO levels, but further rise could damage the "fake stability" really quick."Spain certainly made profound reform of the labour market but it did not pay the same attention to public finances. This is causing us big concern because their yields are rising and it wouldn't take much to recreate trends that could spread to us through contagion, and take us back months."
 |
Spanish 10-Yr Bond Yield |
 |
| Italian 10-Yr Bond Yield |
As SPX has taken out last year's high, we are led to believe that individual investors are finally getting on board of the runaway train. Furthermore, we are led to believe that they are gobbling up "decoupled" U.S. equities, since those are the safest bet among all asset classes, as the treasuries are now in the beginning of the bear market, and foreign equities are going to suffer from global economic slowdown.
And did you also know that pigs can fly?!! Look at the funds flows, provided by ICI on March 21, 2012. Does this look like individual investors are buying U.S. equities?

Friday, March 23, 2012
Charts are amazing! ES vs NQ
As traders we look at past to predict the future. Let's look at example of ES vs NQ the last few sessions. Below are the 4hr charts of the two brothers. You can see how the smaller brother, NQ, is following ES down the same path. NQ is exactly two days behind ES.
 |
| click on chart to enlarge |
Thursday, March 22, 2012
Decouple, decouple!
Decoupling theorists are going to have a field day trying to explain how U.S. will be isolated from global economic weakness.
Today we are witnessing two of the largest economies on the planet displaying contraction in manufacturing sector, which is a leading indicator of economic conditions.
Let's not forget that S&P 500 multinationals' earnings are going to suffer from slowing global economy, which seems to be taking a leg lower.
Below are the PMIs of China and Eurozone, reported overnight by Markit.


 |
| click on charts to enlarge |
Tuesday, March 20, 2012
Charting SPX, Chinese Stocks, Copper, & Miners
China was the main focus of today's trading. Late last night newswires were flashing BHP Billiton's negative comments about "flattening iron ore demand in China". Shanghai Comp along with AUD dove quickly. I am not surprised. As Chinese ghost cities have gone unfilled for years, it is beyond any reason for govt to continue playing their game of deception. There is less need for new factories there as well, as the global economy has slowed tremendously and demand for Chinese-made products has waned.
So I put a few charts together. First is FXI over FCX, BHP, and JJC. And the second is one-year outperformance (and a huge divergence) of SPX vs Shanghai Comp (XLY00) and Copper Futures (HGK12). FXI and the miners are breaking down below their wedges, and Dr. Copper should follow.
This development may affect SPX negatively, as yet another of so many divergences has to be resolved soon.

 |
| click on charts to enlarge |
Monday, March 19, 2012
Put/Call Ratio Hooked Up Today
Please excuse my perpetual skepticism, as I continue to look for a fly in the ointment during this delirious stock market condition.
Today CBOE Equity Put/Call Ratio hooked up after hitting the lowest level since the beginning of 2011. As you can see on the chart below, readings below 0.5 are quite rare, and mostly result in SPX sell-off. One can not predict with certainty the magnitude of the decline, but this is yet another indicator which is flashing a warning.
Today CBOE Equity Put/Call Ratio hooked up after hitting the lowest level since the beginning of 2011. As you can see on the chart below, readings below 0.5 are quite rare, and mostly result in SPX sell-off. One can not predict with certainty the magnitude of the decline, but this is yet another indicator which is flashing a warning.
 |
| click on chart to enlarge |
Stock Market Trading Thoughts on March 19
Stock market has decided that it will never go down again. Sounds familiar? I am not going to turn this blog into Zero Hedge. I promise that I will be bullish again one day. I turned bearish since 1330, not that long time ago. Yes, 70 points of bull missed, and perhaps a bit more, as the quarter-end window dressing may kick in now. I can not chase this "runaway train", just not my style. Here are a few more reasons why I continue to stay cautious, and rather sit the last gasp higher out.
I have been pointing out many divergences in the last few weeks. Some of them are widening out, as others are narrowing. But more are appearing and are yet to be resolved and/or explained.
This one is serious (in my opinion), as corporate health may be in question. LQD and HYG are not participating in this last leg higher. They have disconnected from S&P 500 on Feb 29th, when SPX was at 1365. Why? Shrinking margins, slower EPS growth, what else?? Investment grade and high yield corporate bond investors are sounding an alarm.
I have heard enough of sudden bullish sentiment from bears in the last few weeks to make me even more cautious. They are correct so far, and I should be quiet. But I will provide one very important undeniable fact, and would like everyone to pay extremely close attention to the following. I decided to pull up 20-year chart of SPX. I went back to the start of bull market after Gulf War I, as this was about the time I started paying attention to stock market (and then actively involved myself in trading since 1998). S&P 500 traded below the last year closing price (LYCP) in every one of those 20 years, without exception. This year it is still yet to do so. Will it be "different this time"?
Below is the data sheet I compiled. Average decline below LYCP was 11.81%
I went one step further and excluded the last two bear markets' lows in the years of 2000-02 and 2008-09. Avg decline below LYCP still came in at 5.18%
I repeat, SPX did not trade below LYCP in 2012, yet. Make your own conclusions, but the data is pretty convincing.

I have been pointing out many divergences in the last few weeks. Some of them are widening out, as others are narrowing. But more are appearing and are yet to be resolved and/or explained.
This one is serious (in my opinion), as corporate health may be in question. LQD and HYG are not participating in this last leg higher. They have disconnected from S&P 500 on Feb 29th, when SPX was at 1365. Why? Shrinking margins, slower EPS growth, what else?? Investment grade and high yield corporate bond investors are sounding an alarm.
 |
| click on chart to enlarge |
I have heard enough of sudden bullish sentiment from bears in the last few weeks to make me even more cautious. They are correct so far, and I should be quiet. But I will provide one very important undeniable fact, and would like everyone to pay extremely close attention to the following. I decided to pull up 20-year chart of SPX. I went back to the start of bull market after Gulf War I, as this was about the time I started paying attention to stock market (and then actively involved myself in trading since 1998). S&P 500 traded below the last year closing price (LYCP) in every one of those 20 years, without exception. This year it is still yet to do so. Will it be "different this time"?
Below is the data sheet I compiled. Average decline below LYCP was 11.81%
I went one step further and excluded the last two bear markets' lows in the years of 2000-02 and 2008-09. Avg decline below LYCP still came in at 5.18%
I repeat, SPX did not trade below LYCP in 2012, yet. Make your own conclusions, but the data is pretty convincing.

Friday, March 16, 2012
Bradley meets Fibonacci
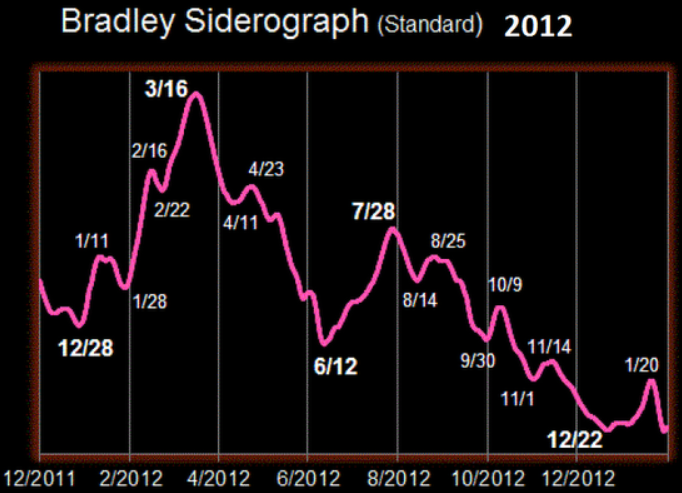
Today is a Bradley Turn Date. While not a directional indicator, it has been a fairly accurate time cycle signal. This got me thinking about another time study.
So I decided to apply Fibonacci time cycles to SPX. I came across a very interesting fact. This March is 144 months from March of 2000 top. The bull market from March of 2003 to October of 2007 lasted 55 months. If you subtract 55 from 144 you get 89, which all happen to be Fibonacci sequence numbers.
It also looks like March is a significant month for making turns, which happened in 9 out of the last 12 years. (marked with yellow arrows)
Could it all be just a coincidence? Only time will tell...
 |
| click on chart to enlarge |
IBM did it again
I am amazed at how accurate the Fibonacci extensions have been working on IBM. It just reached yet another 78.6% fib ext.
More interesting is the fact that after this 78.6% target is hit, IBM then takes a rest. Is pullback now in order?
More interesting is the fact that after this 78.6% target is hit, IBM then takes a rest. Is pullback now in order?
 |
| click on chart to enlarge |
Wednesday, March 14, 2012
Charting Gold and 10-yr T-Note after carnage
Ben Bernanke, aka Helicopter Ben, landed his chopper on Tuesday. While I will not get into a long discussion why I think his operation "money drop" is far from being totally suspended, I would rather use gold and 10-yr t-note as a guide. Both are coming to major supports. Market will tell us if Ben is done or just resting before another takeoff.


 |
| click on charts to enlarge |
Tuesday, March 13, 2012
Market Trading Notes
Do not know where to begin...
Let's start with ME. I am the boss here and there is nobody else to tell me that I am wrong, except for - MARKET.
Market is the most humbling mechanism, reducing adults to small children asking for their parents' mercy right after they have sinned. Market is always right, and the only ones incorrect are the players on the wrong side of it. Market is not to be argued with for extended periods of time, unless a strong conviction and a hedge (or a stop) is present. Market always punishes the complacent ones and rewards the patient ones. I was wrong, I get spanked, I move on... Oh yes, I learn how to be on market's side! (contrarian traders, disregard this last part)
With above in mind, let's quickly assess (funny word) the situation. New 3-yr bull market highs were made in some U.S. equity indexes, with new closing highs in place. So where do we go from here? For a moment today I caught myself thinking I should probably go long. And perhaps the right thing was to buy the breakout, but I am not the one to reverse quickly, so I just observe. The interesting part about this is when bears become bulls - beware of the top. I am no perma bear, I just wanted a pullback to 50 dsma to buy. Short-term bears turning bullish is ok, but perma bears (like Taleb or Roubini) going long scares the daylights out of me. These are bright individuals, thousand times smarter than me - who am I to argue? So instead of plainly saying I feel that we are at short-term top every time we go to new high, (as I have been unsuccessfully looking for one since SPX 1330), I will argue by providing (below) a list of worrisome things bulls will have to consider, as bears are getting run over (yours truly included). Since the notion of U.S. decoupling is running wild on Wall Street, I will discount Europe and Emerging Markets slowing growth affecting S&P 500 earnings as priced in. So let's just concentrate on the next four items.
VIX closed below 15 today. When such happened in the last 5 years, it rallied hard and demolished everyone in its path. Note how falling wedge with apex at support level has once again developed.
RUT, DJT, and SOX are not confirming new highs on SPX, DJI, and COMP. They are struggling to get back above 2012 highs, let alone last year's highs.
The same non-confirmation of risk rally could be seen in Copper, AUD, and CAD. These are commodity plays which should be making new highs along with SPX. Incidentally, CRB index (not shown here) is also not cooperating.
30, 10, and 5 year U.S. treasury yields are slowly rising, but remain significantly below last year's highs, yet another non-confirmation. It looks like bond market has serious doubts about this equity rally, and economic recovery overall.
Let's start with ME. I am the boss here and there is nobody else to tell me that I am wrong, except for - MARKET.
Market is the most humbling mechanism, reducing adults to small children asking for their parents' mercy right after they have sinned. Market is always right, and the only ones incorrect are the players on the wrong side of it. Market is not to be argued with for extended periods of time, unless a strong conviction and a hedge (or a stop) is present. Market always punishes the complacent ones and rewards the patient ones. I was wrong, I get spanked, I move on... Oh yes, I learn how to be on market's side! (contrarian traders, disregard this last part)
With above in mind, let's quickly assess (funny word) the situation. New 3-yr bull market highs were made in some U.S. equity indexes, with new closing highs in place. So where do we go from here? For a moment today I caught myself thinking I should probably go long. And perhaps the right thing was to buy the breakout, but I am not the one to reverse quickly, so I just observe. The interesting part about this is when bears become bulls - beware of the top. I am no perma bear, I just wanted a pullback to 50 dsma to buy. Short-term bears turning bullish is ok, but perma bears (like Taleb or Roubini) going long scares the daylights out of me. These are bright individuals, thousand times smarter than me - who am I to argue? So instead of plainly saying I feel that we are at short-term top every time we go to new high, (as I have been unsuccessfully looking for one since SPX 1330), I will argue by providing (below) a list of worrisome things bulls will have to consider, as bears are getting run over (yours truly included). Since the notion of U.S. decoupling is running wild on Wall Street, I will discount Europe and Emerging Markets slowing growth affecting S&P 500 earnings as priced in. So let's just concentrate on the next four items.
VIX closed below 15 today. When such happened in the last 5 years, it rallied hard and demolished everyone in its path. Note how falling wedge with apex at support level has once again developed.
 |
| click on chart to enlarge |
RUT, DJT, and SOX are not confirming new highs on SPX, DJI, and COMP. They are struggling to get back above 2012 highs, let alone last year's highs.
 |
| click on chart to enlarge |
The same non-confirmation of risk rally could be seen in Copper, AUD, and CAD. These are commodity plays which should be making new highs along with SPX. Incidentally, CRB index (not shown here) is also not cooperating.
 |
| click on chart to enlarge |
30, 10, and 5 year U.S. treasury yields are slowly rising, but remain significantly below last year's highs, yet another non-confirmation. It looks like bond market has serious doubts about this equity rally, and economic recovery overall.
 |
| click on chart to enlarge |
Monday, March 12, 2012
Will VIX Rally Right Now?
Today marks a very rare occasion when VIX trades outside of lower daily Bollinger Band. When this occurs VIX reverses and rallies back inside the band. Furthermore, you can see from the chart below that after the reversal it often travels the entire distance between the bands. With this being the OpEx week, I suggest you seriously look at protecting yourself against a possible quick snapback.
 |
| click on chart to enlarge |
Sunday, March 11, 2012
Will this divergence lead to a sell-off??
In 2010 CRB index did not confirm new SPX high. That divergence resulted in a nasty sell-off. Below is the 3-yr weekly comparison chart of CRB vs SPX. Look at what is happening today! You can dismiss this as a chart voodoo, but getting hit by a bus is going to hurt.
 |
| click on chart to enlarge |
Friday, March 9, 2012
Trading Notes Before NFP
This post will be Eurolesszone, let's take a rest from that madness. There is so much more to discuss...
Rinse and repeat
I think that stock market bounce of the last two sessions is a retrace before another leg lower. I posted what I expect S&P 500 futures to do, I stand by my prediction. Today will probably be the start of the next decline. Let's look at SPX cash scenario. Blue square is a projected target area, may not be all in one move though... Scale out if you are lucky to catch this decline.
SOX
Baseball fans, listen up! Just kidding... When CY warned earlier in the week, I thought to myself: "there will be more". Sure enough ALTR and TXN joined the party in afterhours on Thursday. If CY's excuse was wireline weakness, the worries from ALTR and TXN are going to resonate a bit louder - both blamed wireless customers. This, folks, is no joke! SOX did exactly what I expected. It now retraced back to broken H+S neckline. I expect the next leg lower to sub 400 level to start soon.*
Dow Transports
Here again I will talk about a retrace. 50 dsma and upper t/l of the declining channel will serve as a resistance. I expect the next decline to target 4,980 level, which (by the way) would be negative on the year.*
*Please note: both DJT and SOX have led the declines in the rest of the market, hence they bounced more than the whole market in the last two days. I think that while they will go slightly lower than previous low (from three days ago), they may consolidate at that point while waiting for the rest of the market to catch up. While I am bearish in a very short term, you can clearly see that declines (which they are currently experiencing) are still within bullish structure. Do not get carried away, scale out your profits.
NFP
I am not sure today's report matters much, unless it beats by a lot. As the matter of fact, I think it may serve as an excuse for many bulls to take some profits. Earnings season is over, no more news to propel the market higher, unless AAPL decides to wow us with some TV gadget in the next few days.
Fed
What is this talk about reverse-repo QE3? This is silly and dangerous. I am also a little skeptical about the leak via the newspaper. Coincidence with the rumor coming out the day after the biggest stock market decline of the year is really suspicious. Was it done to calm the market and put a bid under it? In any case, can Fed do it on a large scale and not raise the short-term rates? Makes no sense (to me at least)...
Trade of the year
Vital Keystone XL oil pipeline was axed in Senate today. This is pure madness and will not go unnoticed. I bet all those who voted against will be voted out in November. Gasoline is going to push higher.
I am getting ready to put on a second leg of my trade of the year (long RBOB / short XRT). While XTR made a new all-time high today, MACD and Stoch did not confirm. This divergence can not continue much longer...
Goldman Sachs Weekly Chain Store Sales y/y growth for week ending March 3rd came in the slowest in more than a year. Gasoline prices are starting to eat into consumers' wallets. This is just the beginning, you ain't seen nothing yet!

Aussie
Rinse and repeat
I think that stock market bounce of the last two sessions is a retrace before another leg lower. I posted what I expect S&P 500 futures to do, I stand by my prediction. Today will probably be the start of the next decline. Let's look at SPX cash scenario. Blue square is a projected target area, may not be all in one move though... Scale out if you are lucky to catch this decline.
 |
| click on chart to enlarge |
SOX
Baseball fans, listen up! Just kidding... When CY warned earlier in the week, I thought to myself: "there will be more". Sure enough ALTR and TXN joined the party in afterhours on Thursday. If CY's excuse was wireline weakness, the worries from ALTR and TXN are going to resonate a bit louder - both blamed wireless customers. This, folks, is no joke! SOX did exactly what I expected. It now retraced back to broken H+S neckline. I expect the next leg lower to sub 400 level to start soon.*
 |
| click on chart to enlarge |
Dow Transports
Here again I will talk about a retrace. 50 dsma and upper t/l of the declining channel will serve as a resistance. I expect the next decline to target 4,980 level, which (by the way) would be negative on the year.*
 |
| click on chart to enlarge |
*Please note: both DJT and SOX have led the declines in the rest of the market, hence they bounced more than the whole market in the last two days. I think that while they will go slightly lower than previous low (from three days ago), they may consolidate at that point while waiting for the rest of the market to catch up. While I am bearish in a very short term, you can clearly see that declines (which they are currently experiencing) are still within bullish structure. Do not get carried away, scale out your profits.
NFP
I am not sure today's report matters much, unless it beats by a lot. As the matter of fact, I think it may serve as an excuse for many bulls to take some profits. Earnings season is over, no more news to propel the market higher, unless AAPL decides to wow us with some TV gadget in the next few days.
Fed
What is this talk about reverse-repo QE3? This is silly and dangerous. I am also a little skeptical about the leak via the newspaper. Coincidence with the rumor coming out the day after the biggest stock market decline of the year is really suspicious. Was it done to calm the market and put a bid under it? In any case, can Fed do it on a large scale and not raise the short-term rates? Makes no sense (to me at least)...
Trade of the year
Vital Keystone XL oil pipeline was axed in Senate today. This is pure madness and will not go unnoticed. I bet all those who voted against will be voted out in November. Gasoline is going to push higher.
I am getting ready to put on a second leg of my trade of the year (long RBOB / short XRT). While XTR made a new all-time high today, MACD and Stoch did not confirm. This divergence can not continue much longer...
Goldman Sachs Weekly Chain Store Sales y/y growth for week ending March 3rd came in the slowest in more than a year. Gasoline prices are starting to eat into consumers' wallets. This is just the beginning, you ain't seen nothing yet!

 |
| click on chart to enlarge |
Aussie
Has anyone paid attention to Australian econodata lately? It has been coming in weak. Is slowing China growth affecting Australian economy?? It looks like someone has noticed: S&P/ASX 200 and AUD/USD are rolling over. S&P/ASX 200 broke the trendline, backtesting as I type, should get rejected and continue down some more. AUD/USD should follow, as the two are very closely correlated.


 |
| click on chart to enlarge |
Tuesday, March 6, 2012
S&P 500 Futures Roadmap
Here is what I expect S&P 500 futures to do next.
Remember that on Thursday you should start rolling your indices futures to June contract.
Good luck with your trading!
Remember that on Thursday you should start rolling your indices futures to June contract.
Good luck with your trading!
 |
| click on chart to enlarge |
Sunday, March 4, 2012
Does this look bullish?
Maybe it is because I am under the weather and feeling very grumpy, but I can not pick up major bullishness from the picture below.
Look at the stock market charts of four largest economies in the world.
Dow Jones Industrial Avg is trying to get back to its all-time high. But the other three are so far below their "bubble" highs, that in order to return to them, Shanghai Comp and Euro Stoxx 50 have to more than double, and Nikkei 225 has to almost quadruple. Their long-term downtrends are still intact, and they will continue to be in a secular bear market.
I know, "this time is different", "U.S. will decouple"...
click on charts to enlarge


Friday, March 2, 2012
Weekend Trading Notes
Apologies for the lack of posts, I have been under the weather. So I will keep it short today...
Dow finally closed above 13,000 (once), but was unable to rally much above that level.
I am devoting my undivided attention to how narrow the advance has been lately. Divergences are now visible between many indices. I will stay on this message until it becomes irrelevant.
Below are three comparison charts, which are going to result in powerful moves. No matter if you are long or short, you can not ignore the facts. These divergences will not continue for a long period of time. Something will have to give...
click on charts to enlarge


